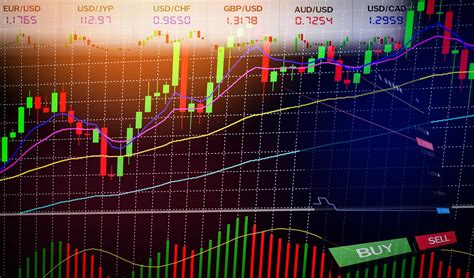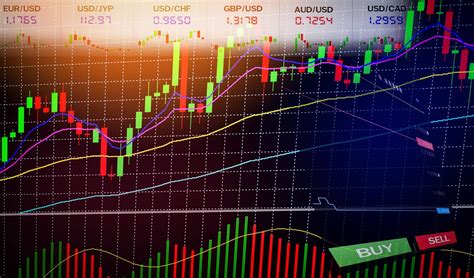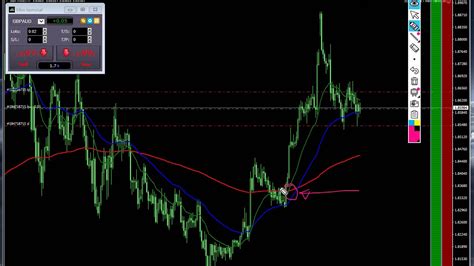

Trading indicators are tools that help traders analyze market trends and make informed decisions. They use statistical calculations to predict market movements.
Trading indicators are essential tools for traders to make informed decisions in the financial market. With a plethora of options available, it can be overwhelming for novice traders to determine which indicators are worth using. However, by understanding the different types of indicators and how they work together, traders can gain a significant advantage in their trading strategies.
Firstly, technical indicators such as moving averages and relative strength index (RSI) help traders identify trends and momentum. By analyzing past price movements, these indicators provide insights into potential future price movements and highlight buy or sell signals.
Additionally, fundamental indicators such as gross domestic product (GDP) and inflation rates offer a broader picture of the market’s health. These indicators assess the overall economic conditions that could impact asset prices and help traders gauge the market sentiment.
Moreover, combining multiple indicators can provide a more comprehensive analysis of the market, enabling traders to make better-informed decisions. However, it is crucial to understand that no indicator is foolproof and should be used in conjunction with other tools and market knowledge.
In conclusion, trading indicators offer invaluable insights into the financial markets and can assist traders in making profitable decisions. Understanding the various types of indicators and how they work together is key to utilizing them effectively.
Daftar Isi
Introduction
When it comes to trading, one of the most important aspects is identifying trends and patterns in the market. This is where trading indicators come into play. Trading indicators are mathematical calculations based on the price and/or volume of a security. They help traders identify potential entry and exit points for trades, as well as provide insight into market trends and momentum. In this article, we will discuss some common trading indicators and how they can be used to improve your trading strategy.
Moving Averages
Moving averages are one of the most commonly used trading indicators. They are calculated by taking the average price of a security over a certain period of time, such as 50 or 200 days. Moving averages can help identify trends in the market, as well as potential entry and exit points for trades. Traders often use a crossover strategy with moving averages, where they look for the shorter-term moving average to cross above or below the longer-term moving average as a signal to enter or exit a trade.
The 50-Day Moving Average
The 50-day moving average is a popular indicator among traders. It is used to identify the short-term trend of a security. When the price of a security is above its 50-day moving average, it is considered to be in an uptrend. Conversely, when the price is below its 50-day moving average, it is considered to be in a downtrend.
The 200-Day Moving Average
The 200-day moving average is another widely used indicator. It is used to identify the long-term trend of a security. When the price of a security is above its 200-day moving average, it is considered to be in a long-term uptrend. When the price is below its 200-day moving average, it is considered to be in a long-term downtrend.
Relative Strength Index (RSI)
The Relative Strength Index (RSI) is a momentum indicator that measures the strength of a security’s price action. It is calculated by comparing the average gains and losses over a certain period of time, typically 14 days. The RSI ranges from 0 to 100, with readings above 70 indicating that a security is overbought and readings below 30 indicating that a security is oversold.
Using RSI to Identify Overbought and Oversold Levels
Traders often use the RSI to identify potential buying or selling opportunities. When the RSI is above 70, it is considered to be overbought, and traders may look for a potential reversal in the price action. Conversely, when the RSI is below 30, it is considered to be oversold, and traders may look for a potential buying opportunity.
Bollinger Bands
Bollinger Bands are another popular trading indicator. They are comprised of three lines: a simple moving average in the middle, and an upper and lower band that are two standard deviations away from the moving average. Bollinger Bands can help traders identify potential breakouts and reversals in the market.
Using Bollinger Bands to Identify Breakouts
Traders often use Bollinger Bands to identify potential breakouts in the market. When the price of a security is trading near the upper or lower band, it is considered to be at an extreme level. If the price breaks through the upper or lower band, it may be a signal that a breakout is occurring.
Stochastic Oscillator
The Stochastic Oscillator is a momentum indicator that compares the closing price of a security to its price range over a certain period of time, typically 14 days. The Stochastic Oscillator ranges from 0 to 100, with readings above 80 indicating that a security is overbought and readings below 20 indicating that a security is oversold.
Using the Stochastic Oscillator to Identify Trend Reversals
Traders often use the Stochastic Oscillator to identify potential trend reversals. When the Stochastic Oscillator is in overbought territory, it may be a signal that the uptrend is losing momentum and a reversal may be imminent. Conversely, when the Stochastic Oscillator is in oversold territory, it may be a signal that the downtrend is losing momentum and a reversal may be imminent.
Conclusion
Trading indicators can be powerful tools for traders looking to improve their trading strategies. By using indicators such as moving averages, RSI, Bollinger Bands, and the Stochastic Oscillator, traders can identify potential entry and exit points for trades, as well as gain insight into market trends and momentum. It’s important to remember that no single indicator is foolproof, and traders should always use multiple indicators and analysis techniques to make informed trading decisions.
Understanding Trading Indicators: A Comprehensive Guide
Trading indicators are essential tools that traders use to analyze the market and make informed trading decisions. These indicators are mathematical calculations derived from price and volume data, which help traders understand the trend, momentum, and potential reversal points in the market.
Types of Trading Indicators
There are numerous types of trading indicators, but the most commonly used ones are moving averages, Relative Strength Index (RSI), Moving Average Convergence Divergence (MACD), Bollinger Bands, and Fibonacci retracements. Moving averages are trend-following indicators that smooth out price data and show the average price over a specific period. RSI is a momentum oscillator that measures the strength of an asset’s recent price action to determine overbought or oversold conditions. MACD is a trend-following momentum indicator that shows the relationship between two moving averages. Bollinger Bands are volatility indicators that measure the price’s high and low levels relative to its moving average. Fibonacci retracements are trend-following indicators that predict potential support and resistance levels based on the Fibonacci sequence.
How Trading Indicators Work
Trading indicators work by analyzing historical price and volume data to identify patterns and trends that can help traders make informed trading decisions. Indicators are calculated using mathematical algorithms and plotted on charts to provide visual representations of market trends. When analyzing the market with indicators, traders look for patterns and signals that suggest buying or selling opportunities. Indicators are not foolproof, and traders should always consider other factors such as news events and market sentiment before making any trades.
What Do Trading Indicators Show?
Trading indicators show various aspects of the market, including trend direction, momentum, volatility, and potential reversal points. Trend-following indicators like moving averages and MACD show the direction of the trend, while momentum indicators like RSI and MACD show the strength of the trend. Volatility indicators like Bollinger Bands show the price’s high and low levels relative to its moving average, while Fibonacci retracements predict potential support and resistance levels based on the Fibonacci sequence.
Popular Trading Indicators Used by Traders
Traders use a variety of indicators to analyze the market, but some of the most popular ones include moving averages, RSI, MACD, Bollinger Bands, and Fibonacci retracements. Moving averages are popular among traders because they are easy to use and provide a clear indication of the trend’s direction. RSI is popular among traders because it helps identify overbought or oversold conditions in the market. MACD is popular among traders because it shows the relationship between two moving averages and helps identify potential trend reversals. Bollinger Bands are popular among traders because they help identify potential breakouts and measure volatility. Fibonacci retracements are popular among traders because they predict potential support and resistance levels based on the Fibonacci sequence.
How to Use Trading Indicators in Your Trading Strategy
Trading indicators can be used in various ways to improve your trading strategy. One way to use them is to combine multiple indicators to confirm trading signals. For example, you can use moving averages to determine the trend’s direction and RSI to confirm overbought or oversold conditions before entering a trade. Another way to use indicators is to use them as a filter to avoid false signals. For instance, you can use Bollinger Bands to identify potential breakout points and only enter trades when the price breaks out of the bands. Whatever the approach, it’s essential to backtest your trading strategy using historical data before using it in real-time trading.
Advantages of Using Trading Indicators
One of the main advantages of using trading indicators is that they help traders make informed trading decisions by providing visual representations of market trends. Indicators can also help traders avoid emotional trading by providing objective data to base trading decisions on. Additionally, indicators can help traders identify potential trading opportunities that they may have missed without their use.
Limitations of Trading Indicators
While trading indicators can be useful tools, they also have limitations that traders should be aware of. One limitation is that they are based on historical data and may not accurately predict future price movements. Additionally, indicators can provide conflicting signals, making it challenging to make informed trading decisions. Finally, over-reliance on indicators can lead to analysis paralysis, where traders become overwhelmed by the amount of data and fail to make any trades.
Combining Multiple Trading Indicators for Better Results
Combining multiple indicators can help traders confirm trading signals and improve their trading strategy’s accuracy. For example, you can use moving averages to determine the trend’s direction, RSI to confirm overbought or oversold conditions, and Bollinger Bands to identify potential breakout points. However, it’s essential to use indicators that complement each other rather than ones that provide similar information.
Importance of Understanding the Market Trends with Trading Indicators
Understanding market trends is crucial when using trading indicators because it helps traders identify potential trading opportunities and avoid false signals. By analyzing the market’s trend and momentum using indicators, traders can make informed trading decisions and improve their overall trading strategy’s accuracy. Additionally, understanding market trends can help traders avoid emotional trading and stick to their trading plan.
In conclusion, trading indicators are valuable tools that traders can use to analyze the market and make informed trading decisions. While indicators have limitations, they can be useful when combined with other analysis tools and used in conjunction with other factors such as news events and market sentiment. To use trading indicators effectively, traders should understand the different types of indicators available, how they work, and how to use them in their trading strategy.
As a journalist covering the financial markets, it’s essential to understand the use of trading indicators. These tools are widely used by traders to help them make informed decisions about buying and selling assets. However, there are pros and cons to using these indicators.
Pros:
- Helps to identify trends: Trading indicators can be used to identify trends in the market, which can be helpful for traders looking to make profitable trades.
- Provides entry and exit points: Indicators can help traders determine the best time to enter or exit a trade, which can lead to increased profitability.
- Reduces emotional bias: Trading indicators take the emotion out of trading decisions, which can help traders avoid making irrational decisions based on fear or greed.
- Easy to use: Most trading platforms come with built-in indicators, making it easy for traders to incorporate them into their trading strategies.
Cons:
- Can be lagging: Some indicators can be slow to respond to changes in the market, which can result in missed opportunities or losses.
- Can give false signals: Indicators can sometimes give false signals, leading traders to make trades that end up being unprofitable.
- Can be overused: Relying too heavily on indicators can lead to a lack of creativity in trading strategies, which can limit profitability.
- Can be misunderstood: It’s important for traders to fully understand the indicators they are using to avoid misinterpreting signals and making bad trades.
Overall, trading indicators can be a useful tool for traders looking to make informed decisions in the financial markets. However, it’s important to weigh the pros and cons before incorporating them into a trading strategy.
As a journalist, it is my duty to inform the public about the latest trends and developments in every industry, including trading. Trading indicators have been gaining popularity among traders, especially those who are new to the industry. These indicators are tools that help traders analyze the market and make informed decisions based on their analysis. However, it is essential to understand that trading indicators are not a guarantee for success in trading.
Before using any trading indicator, traders must first understand how it works. Some indicators are best suited for specific markets or trading styles, so it is crucial to choose the right one that fits your needs. Traders should also avoid relying solely on trading indicators. They should use them in combination with other analysis tools such as price action, support and resistance levels, and market news to get a more accurate picture of the market.
In conclusion, trading indicators can be an excellent addition to a trader’s toolkit, but they are not a magic bullet for success in trading. Traders should take the time to learn how to use them effectively and combine them with other analysis tools to make informed decisions. Remember that trading is a risky business, and there are no guarantees for success. Always trade responsibly and never risk more than you can afford to lose.
Video trading indicators
As a journalist covering the world of finance, I often get asked about trading indicators. Here are some of the most common questions people ask about trading indicators and my answers:
1. What are trading indicators?
- Trading indicators are mathematical calculations based on the price and/or volume of a security.
- They are used by traders to identify trends, support and resistance levels, and potential entry and exit points for trades.
2. How do I use trading indicators?
- Trading indicators can be added to a chart in your trading platform.
- Traders use them to confirm or contradict their analysis of price action or other indicators.
- It’s important to remember that trading indicators are just one tool in a trader’s toolbox and should not be relied on exclusively.
3. What are some common trading indicators?
- Moving averages
- Relative strength index (RSI)
- Stochastic oscillator
- Bollinger Bands
- MACD (Moving Average Convergence Divergence)
4. Are trading indicators reliable?
- Like any tool, trading indicators are only as reliable as the person using them.
- Traders should always do their own analysis and not rely solely on trading indicators.
- It’s also important to remember that trading indicators are based on past price and volume data and cannot predict future market movements with certainty.
5. Can trading indicators be used for all types of securities?
- While trading indicators can be used for any security, they may be more effective for some than others.
- For example, some traders find that moving averages work better for stocks, while RSI and stochastic oscillators are more effective for forex trading.
Overall, trading indicators can be a useful tool for traders to help them identify potential trading opportunities. However, it’s important to remember that they are just one part of a trader’s overall analysis and should not be relied on exclusively.


