

Discover the best trading indicator to improve your profits and make informed decisions in the stock market. Maximize your gains with our expert guidance.
Are you tired of using trading indicators that don’t seem to work? Are you looking for the best trading indicator out there that can help you make profitable trades? Look no further! We’ve done our research and found the top trading indicator that traders swear by. This indicator has been proven to provide accurate signals time and time again, giving traders an edge in the market. But don’t just take our word for it, let’s dive into the details and see why this indicator is a game-changer.
Daftar Isi
The Search for the Best Trading Indicator
As a trader, you rely heavily on technical analysis to make informed decisions about your trades. And one of the most crucial tools in your arsenal is the trading indicator. With so many options available, it can be overwhelming to choose the right one for your strategy. In this article, we’ve scoured through various indicators to find the best ones that have stood the test of time.
Moving Averages
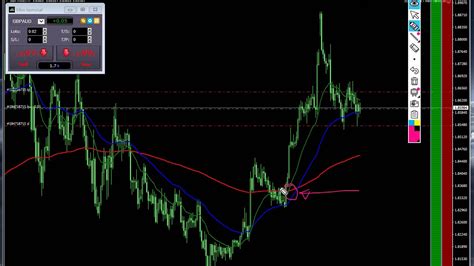
One of the most widely used trading indicators is the moving average. It’s a simple tool that tracks the average price of a security over a specified period. The most common types are the simple moving average (SMA) and the exponential moving average (EMA). The SMA is more straightforward, while the EMA places more weight on recent price action. Traders use moving averages to determine support and resistance levels and trend direction.
Relative Strength Index
The Relative Strength Index (RSI) is a momentum oscillator that measures the speed and change of price movements. It ranges from 0 to 100, with readings above 70 indicating overbought conditions and below 30 indicating oversold conditions. Traders use the RSI to identify potential trend reversals and confirm price trends.
Bollinger Bands
Bollinger Bands consist of three lines – a simple moving average in the middle and two outer bands that are two standard deviations away from the average. They help traders identify volatility and potential price breakouts. When the price touches the upper band, it indicates overbought conditions, and when it touches the lower band, it indicates oversold conditions.
Fibonacci Retracement
The Fibonacci retracement tool is based on the idea that markets tend to retrace a predictable portion of a move, after which they continue in the original direction. Traders use Fibonacci levels to identify potential support and resistance levels. The most commonly used levels are 38.2%, 50%, and 61.8%.
Ichimoku Cloud
The Ichimoku Cloud is a complex indicator that provides a holistic view of price action. It consists of five lines that show support and resistance levels, trend direction, and momentum. The cloud itself represents an area of support or resistance. Traders use the Ichimoku Cloud to identify potential trade opportunities and determine stop-loss levels.
MACD
The Moving Average Convergence Divergence (MACD) is a trend-following momentum indicator that shows the relationship between two moving averages. Traders use the MACD to identify trend direction and potential trend reversals. When the MACD line crosses above the signal line, it’s a bullish signal, and when it crosses below, it’s a bearish signal.
Stochastic Oscillator
The Stochastic Oscillator is a momentum indicator that compares the closing price of a security to its price range over a specified period. It ranges from 0 to 100, with readings above 80 indicating overbought conditions and below 20 indicating oversold conditions. Traders use the Stochastic Oscillator to identify potential trend reversals and confirm price trends.
Volume
Trading volume is a crucial factor in technical analysis. It measures the number of shares or contracts traded in a particular security over a given period. High volumes often indicate significant price movements, while low volumes suggest a lack of interest in the security. Traders use volume to confirm price trends and identify potential breakouts or reversals.
Conclusion
While there’s no one-size-fits-all approach to trading indicators, the ones we’ve discussed in this article are some of the most popular and effective tools used by traders worldwide. It’s essential to remember that no indicator is foolproof and should be used in conjunction with other technical analysis tools. Ultimately, your success as a trader depends on your ability to interpret price action accurately and make informed decisions.
Trading indicators are essential tools for traders to make informed decisions and predict market trends. With a wide range of trading indicators available, selecting the best one for your trading style can be a daunting task. In this article, we explore ten of the most popular trading indicators used by traders worldwide.Moving Averages is a widely used technical indicator that calculates the average price of a security over a specified period. It’s a versatile indicator that helps traders analyze the trend and momentum of a security. Traders use Moving Averages to identify potential buy and sell signals.The Relative Strength Index (RSI) is an oscillator that measures the strength of a security by comparing its average gains to its average losses. Traders use RSI to identify oversold and overbought conditions. When the RSI value is above 70, it indicates that the security is overbought, and when it’s below 30, it indicates that the security is oversold.Bollinger Bands is a volatility indicator that uses a band of moving averages to measure the price’s deviation from a central average. Traders use Bollinger Bands to identify potential reversals and breakouts. When the price hits the upper band, it indicates that the security is overbought, and when it hits the lower band, it indicates that the security is oversold.The Moving Average Convergence Divergence (MACD) indicator measures the divergence between two moving averages, providing a visual representation of trend and momentum. Traders use MACD to identify potential entry and exit points. When the MACD line crosses above the signal line, it indicates a bullish signal, and when it crosses below the signal line, it indicates a bearish signal.Fibonacci Retracement is a technical analysis tool that uses horizontal lines to indicate areas of potential price support and resistance. Traders use Fibonacci Retracement to predict price movements. The tool is based on the Fibonacci sequence, which is a mathematical sequence that appears in many natural phenomena.The Stochastic Oscillator is a momentum indicator that measures the strength of a security by comparing its closing price to its price range over a specified period. Traders use the Stochastic Oscillator to identify potential price reversals. When the oscillator value is above 80, it indicates that the security is overbought, and when it’s below 20, it indicates that the security is oversold.The Average True Range (ATR) indicator measures a security’s volatility by calculating the average range of price movements over a specified period. Traders use ATR to identify potential breakouts and to set stop-loss levels. The tool helps traders determine the amount of risk they should take on a particular trade.The Ichimoku Cloud is a technical analysis tool that displays support and resistance levels and measures a security’s trend and momentum. Traders use the Ichimoku Cloud to identify potential price reversals. The tool consists of several lines that help traders identify key levels of support and resistance.The Relative Vigor Index (RVI) is a technical indicator that measures a security’s momentum by comparing its closing price to its price range over a specified period. Traders use the RVI to identify price trends and potential reversals. When the RVI value is above zero, it indicates that the security is in an uptrend, and when it’s below zero, it indicates that the security is in a downtrend.The Williams %R indicator measures a security’s momentum by comparing its closing price to its price range over a specified period. Traders use Williams %R to identify overbought and oversold conditions and potential price reversals. When the Williams %R value is above 80, it indicates that the security is overbought, and when it’s below 20, it indicates that the security is oversold.In conclusion, selecting the right trading indicator can be a challenging task, but understanding the different types of indicators and how they work can help you make informed trading decisions. Consider experimenting with different indicators to find the one that best fits your trading style. Remember that no indicator is perfect, and it’s essential to use multiple indicators to confirm your trading decisions. Happy trading!
As a journalist covering the financial markets, I have come across various trading indicators that traders swear by. But which one is the best? Let’s take a closer look at one of the most popular indicators and its pros and cons.
The Moving Average
The moving average is a widely used trading indicator that helps traders identify trends and potential entry and exit points. It is calculated by averaging the closing price of a security over a specific period, such as 20 days or 50 days.
Pros:
- Trend identification: The moving average can help traders identify the direction of the trend. If the price is above the moving average, it indicates an uptrend, and if it’s below, it indicates a downtrend.
- Entry and exit points: Traders use moving averages to identify potential entry and exit points. For example, if the price crosses above the moving average, it could be a signal to buy, and if it crosses below, it could be a signal to sell.
- Easy to use: The moving average is easy to understand and use. Even beginners can quickly grasp the concept and incorporate it into their trading strategy.
Cons:
- Lagging indicator: The moving average is a lagging indicator, meaning it’s based on past data. It may not be the best indicator for traders looking for real-time signals.
- Whipsaws: The moving average can produce false signals during range-bound markets, resulting in whipsaws. Traders need to filter out these signals to avoid losses.
- Not suitable for all markets: The moving average may not be effective in all markets. For example, it may work well in trending markets but not in choppy or volatile markets.
In conclusion, the moving average is a popular trading indicator that can help traders identify trends and potential entry and exit points. However, it has its pros and cons, and traders need to understand how to use it effectively to avoid losses.
As a journalist, it is my duty to inform and educate my readers about the latest trends in the financial industry. One of the most important aspects of trading is having access to the right indicators that can help you make informed decisions and maximize your profits. However, with so many options available, it can be challenging to determine which indicator is the best for your trading needs.
In my experience, the best trading indicator is one that is simple, easy to understand, and provides accurate information. The indicator should be able to track market trends, identify potential entry and exit points, and offer insights into market volatility. Additionally, the indicator should be adaptable to different trading styles and timeframes, whether you are a short-term or long-term trader.
Ultimately, the best trading indicator is one that works for you. It is essential to do your research, test different indicators, and find the one that aligns with your trading strategy and goals. Remember that no indicator is foolproof, and there is always risk involved in trading. However, with the right tools and knowledge, you can increase your chances of success and achieve your financial goals.
In conclusion, finding the best trading indicator can be a daunting task, but it is crucial to your success as a trader. Keep in mind that simplicity, accuracy, and adaptability are key factors to consider when choosing an indicator. Take the time to test different options, and don’t be afraid to seek advice from experienced traders. With dedication and patience, you can find the indicator that works best for you and take your trading to the next level.
Video best trading indicator
As a journalist, I often come across questions from people about the best trading indicator. Here are some of the most common questions and answers:
1. What is a trading indicator?
A trading indicator is a tool used by traders to analyze market trends and make informed trading decisions. It is usually a mathematical calculation based on the price and/or volume of a particular security.
2. What are the types of trading indicators?
There are several types of trading indicators, including:
- Trend indicators
- Oscillators
- Volumes indicators
- Volatile indicators
- Strength indicators
3. What is the best trading indicator?
There is no one best trading indicator as each one has its own strengths and weaknesses. However, some popular indicators among traders include:
- Moving averages
- Relative strength index (RSI)
- Bollinger bands
- Stochastic oscillator
- MACD (moving average convergence divergence)
4. How do I choose the right trading indicator?
The choice of a trading indicator depends on your trading strategy and personal preferences. It is important to test different indicators and see how they perform in different market conditions.
5. Can trading indicators guarantee profits?
No, trading indicators cannot guarantee profits. They are just tools to help traders make informed decisions. Successful trading requires a combination of technical analysis, fundamental analysis, risk management, and discipline.
Overall, it is important to remember that trading indicators should be used as part of a comprehensive trading strategy and not relied upon solely for making trading decisions.